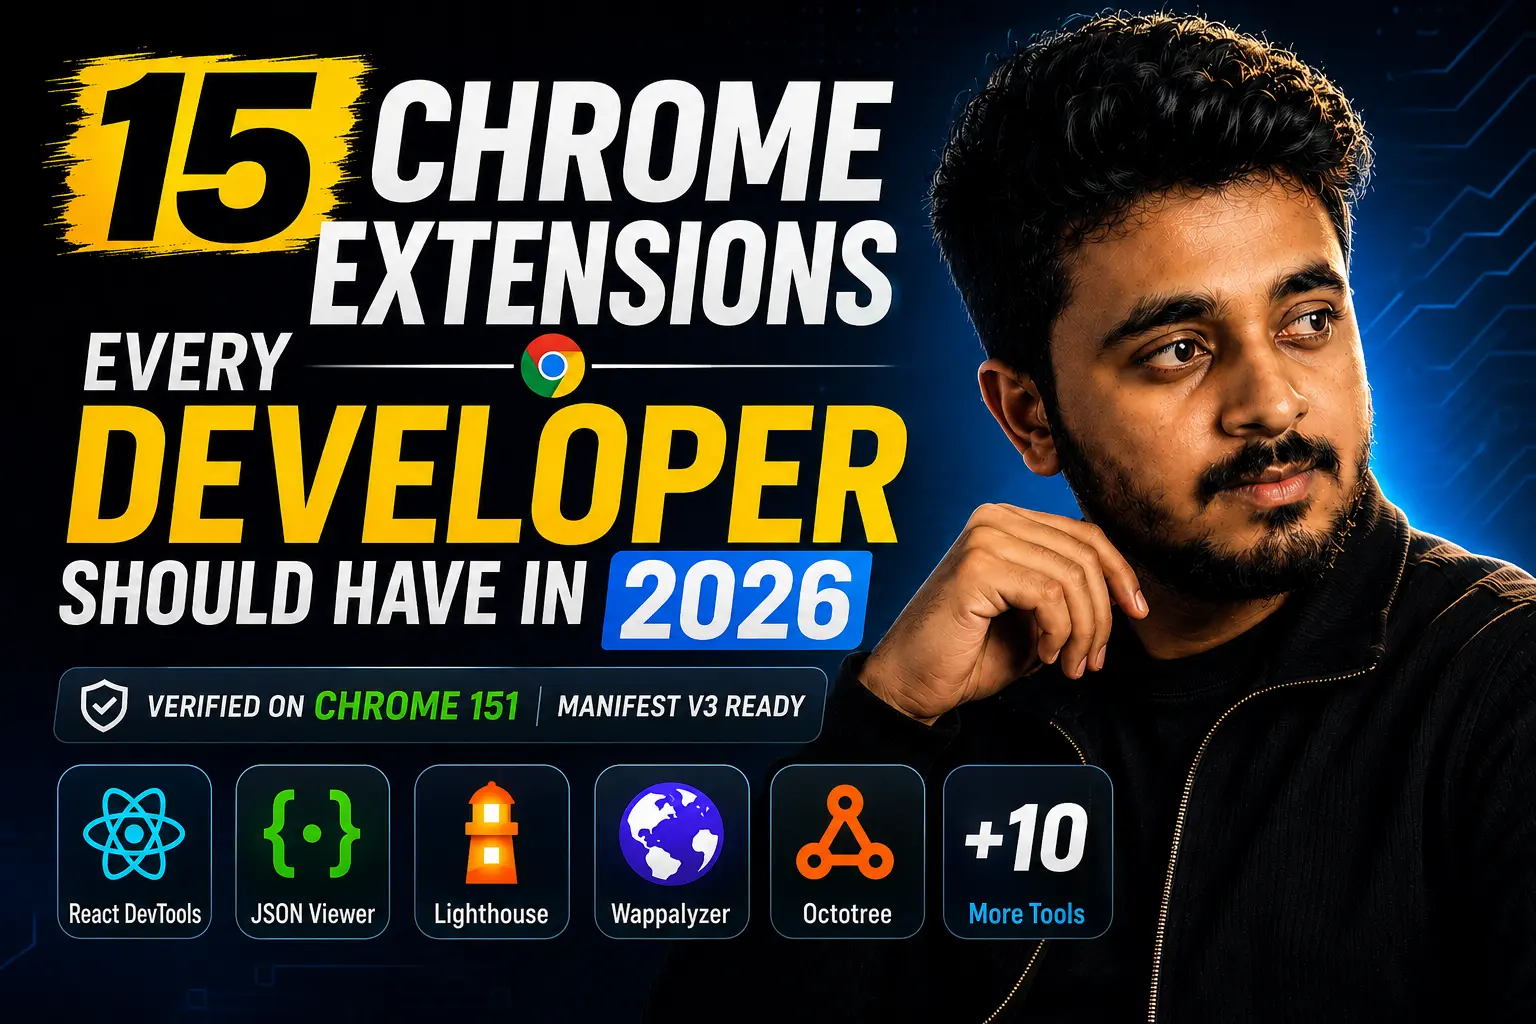
- 1This list is built from what I actually keep installed while building Django + React production apps — not a generic roundup of whatever ranks well in search.
- 2A few of these (React DevTools, JSON Viewer) are close to non-negotiable if you're working with a React frontend or a DRF/REST API on the backend.
- 3IMPORTANT UPDATE: ModHeader, previously recommended here for header/auth testing, was pulled from the Chrome Web Store in July 2026 after researchers found a hidden data-collection module in its signed release. It has been replaced below with an open-source alternative — uninstall ModHeader if you still have it installed.
- 4Performance tools like Lighthouse and Web Vitals matter for more than SEO — they're how you catch CLS and load-time regressions before a client does.
- 5Everything here is Manifest V3 compatible and was re-verified on Chrome 151 (current stable as of early August 2026) — nothing on this list is at risk of quietly breaking.
15 Chrome Extensions Every Developer Should Have Installed in 2026
Published: August 3, 2026 · Updated: August 7, 2026 · 12 min read · By Veeresh Bashetti
⚠️ Update (August 7, 2026): This post previously recommended ModHeader for header and auth-token testing. In July 2026, Google and Microsoft pulled ModHeader from the Chrome Web Store and Edge Add-ons after researchers found a hidden data-collection module in its official, signed build. If you have it installed, remove it and rotate any secrets you had stored in its profiles. The entry below has been replaced with an actively maintained, open-source alternative.
Why I Built This List From My Own Toolbar
Most "best extensions for developers" posts are the same ten tools that have been copy-pasted since 2021 — some of them abandoned, a couple broken since Chrome finished retiring Manifest V2. I went through my own browser toolbar instead: what I actually reach for daily building Django + React production systems like GPMS and Mahalaxmi Implements, testing DRF endpoints, and debugging CSS on the blog.
Everything below is:
- Actively maintained and Manifest V3 compatible
- Something I use on real projects, not a tool I installed once and forgot about
- Free, unless noted otherwise
- Re-checked on Chrome 151 (current stable as of early August 2026) before publishing
Who Should Use These Extensions?
- Frontend / React developers — React Developer Tools and Redux DevTools are close to mandatory; CSS Peeper and ColorZilla speed up matching an existing design system.
- Backend / API developers (Django REST Framework, Node, etc.) — JSON Viewer, Talend API Tester, and ModHeader v2 turn testing an endpoint into a few clicks instead of a context switch to Postman.
- Freelancers and agency developers juggling multiple client codebases — Octotree and Refined GitHub cut down time spent navigating unfamiliar repos during handoffs and reviews.
- Anyone shipping to production — Lighthouse and Web Vitals catch performance and accessibility regressions before a client or search engine does.
- Solo developers on tight timelines — Cache Killer and Web Developer remove small daily friction points that add up over a full day of iteration.
If you only install three, make them React Developer Tools (or the framework-agnostic equivalent for your stack), JSON Viewer, and Lighthouse — they cover the widest range of day-to-day debugging.
Quick Comparison
| Extension | Category | Best For | Price | Rating |
|---|---|---|---|---|
| React Developer Tools | DOM/State | Any React project | Free | 9.6/10 |
| Redux DevTools | DOM/State | Redux-based state | Free | 8.7/10 |
| JSON Viewer | DOM/State | Reading raw API responses | Free | 9.2/10 |
| ModHeader v2 | API Testing | Header/token overrides | Free | 8.5/10 |
| Talend API Tester | API Testing | Quick REST/SOAP requests | Free | 8.5/10 |
| CSS Peeper | CSS/Layout | Extracting colors & fonts | Free | 8.6/10 |
| Web Developer | CSS/Layout | All-in-one dev toolbar | Free | 8.4/10 |
| Pesticide | CSS/Layout | Instant layout outlines | Free | 8.2/10 |
| Lighthouse | Performance | Full page audits | Free | 9.3/10 |
| Web Vitals | Performance | Live CWV monitoring | Free | 8.5/10 |
| Refined GitHub | Git Workflow | PR review & diffs | Free | 9.0/10 |
| Octotree | Git Workflow | Repo file-tree browsing | Free / Pro | 8.7/10 |
| Wappalyzer | Utility | Identifying a site's stack | Free | 8.3/10 |
| Cache Killer | Utility | Forcing fresh assets | Free | 8.1/10 |
| ColorZilla | Utility | Picking colors from any page | Free | 8.6/10 |
DOM & State Inspection
1. React Developer Tools
⭐⭐⭐⭐⭐ 9.6/10 — Close to mandatory for any React project
🔗 Get it on the Chrome Web Store
📸 [Screenshot placeholder — add a screenshot of the Components/Profiler tabs in DevTools here before publishing]
Adds a "Components" and "Profiler" tab to Chrome DevTools, letting you inspect the component tree, live props and state, and re-render performance without console.log-ing everything.
Why it matters: debugging a nested component tree without this is painful — you're guessing at state instead of watching it change in real time.
Best for: any React or Vite frontend, including the pattern used across this blog and AgroMart.
Pros:
- Free, maintained directly by the React core team
- Works with any React app regardless of state management approach
- Profiler tab catches unnecessary re-renders that are easy to miss otherwise
Cons:
- Adds no value on non-React pages (the icon stays greyed out)
- Profiler output can be overwhelming on very large component trees until you know what to filter
2. Redux DevTools
⭐⭐⭐⭐ 8.7/10 — Essential, but only if the project uses Redux
🔗 Get it on the Chrome Web Store
📸 [Screenshot placeholder — add a screenshot of the time-travel action history panel here]
Shows the full action history and store state over time, with time-travel debugging to step backward through state changes.
Why it matters: for Context-based or plain useState projects it adds nothing — but on a Redux-driven app it turns "why did the state change" into a two-second lookup.
Best for: larger React apps managing complex shared state through Redux specifically.
Pros:
- Time-travel debugging is genuinely faster than reproducing a bug by hand
- Open source, no telemetry, works offline
Cons:
- Dead weight in the toolbar on any project that isn't using Redux
- Can slow down tab performance on apps with very high-frequency dispatches unless you tune the max age setting
API Testing
3. JSON Viewer
⭐⭐⭐⭐⭐ 9.2/10 — Turns raw API responses into something readable
🔗 Get it on the Chrome Web Store
📸 [Screenshot placeholder — add a screenshot of a formatted DRF JSON response here]
Auto-formats and color-codes any JSON response opened directly in the browser, with collapsible nodes for nested objects and arrays.
Why it matters: testing a Django REST Framework endpoint by hitting the URL directly is instant instead of squinting at an unformatted wall of text.
Best for: anyone working against a DRF, Node, or other JSON API day to day.
Pros:
- Zero configuration, works the moment it's installed
- Open source, validates malformed JSON instead of just failing silently
Cons:
- Several near-identical "JSON Viewer" extensions exist on the Web Store — double-check the publisher before installing
- Doesn't help with request building, only response viewing
4. ModHeader v2 (replacement pick — see the update note above)
⭐⭐⭐⭐ 8.5/10 — Inject or override request headers without leaving the browser
🔗 Get it on the Chrome Web Store
📸 [Screenshot placeholder — add a screenshot of a header profile with an Authorization override here]
Lets you add, modify, or remove request and response headers, cookies, redirects, and CSP rules per URL pattern — commonly used to attach an auth token or test how an endpoint behaves with different headers. All rules stay local to your device.
Why it matters: testing a JWT-protected endpoint (like the auth flow in Mangalam Millan) is a lot faster than switching to a separate API client for a one-off header check.
Best for: quick, repeated testing of authenticated endpoints during active development.
Pros:
- Open source, rules stored locally, no cloud sync of your header profiles
- Positioned as a direct, "clean" replacement after the original ModHeader's removal
Cons:
- Newer listing with a smaller install base and review history than the extension it replaces — worth re-checking its permissions periodically
- Like any header-editing extension, it needs broad site access to function, so only keep rules enabled while actively testing
5. Talend API Tester
⭐⭐⭐⭐ 8.5/10 — A lightweight Postman alternative that lives in the browser
🔗 Get it on the Chrome Web Store
📸 [Screenshot placeholder — add a screenshot of a saved request collection here]
Lets you build and send GET/POST/PUT/DELETE requests with custom headers and bodies, and save request collections for reuse. Formerly known as Restlet Client.
Why it matters: for a fast sanity check on an endpoint, this avoids the friction of alt-tabbing to a full standalone app.
Best for: quick manual API checks without needing the full feature set of desktop Postman.
Pros:
- Imports existing Postman Collections and OpenAPI/Swagger specs
- Assertions on status, headers, and body let you turn a manual check into a repeatable one
Cons:
- Like ModHeader, it requires "read and change all your data on websites you visit" permission — standard for this category of tool, but worth being deliberate about when it's enabled
- UI feels dated next to newer standalone API clients
CSS & Layout Debugging
6. CSS Peeper
⭐⭐⭐⭐ 8.6/10 — Extracts colors, fonts, and assets from any site
🔗 Get it on the Chrome Web Store
📸 [Screenshot placeholder — add a screenshot of the color palette / asset panel here]
Pulls a page's full color palette, font stack, and image/SVG assets into a clean panel, without manually digging through DevTools' computed styles.
Why it matters: useful for quickly referencing how another site implemented a layout or color scheme before building something similar with Tailwind.
Best for: matching or referencing another site's visual design quickly.
Pros:
- Cleaner, faster workflow than DevTools' computed-styles panel for this specific task
- Asset extraction (images/SVGs) saves a manual "inspect → find URL → download" loop
Cons:
- Some advanced features are gated behind a paid tier
- Doesn't replace full DevTools for anything beyond style/asset extraction
7. Web Developer
⭐⭐⭐⭐ 8.4/10 — The classic all-in-one dev toolbar, still maintained
🔗 Get it on the Chrome Web Store
📸 [Screenshot placeholder — add a screenshot of the toolbar dropdown menu here]
A toolbar of utilities: disable CSS or JS, outline elements, view form details, resize the viewport, and more, all from one menu, by Chris Pederick.
Why it matters: it's been around for over a decade for a reason — most of what it does duplicates DevTools, but having it as one click instead of several nested panels saves real time.
Best for: quick layout and markup checks without digging through DevTools menus.
Pros:
- Extremely mature, well-documented, actively maintained
- Covers a wide range of small utilities in one place
Cons:
- Was briefly compromised via a phishing attack on the developer's account in 2017 (fixed within hours, addressed in v0.5+) — a reminder to keep Chrome's auto-update on rather than pin an old version
- Feature-dense menu can feel cluttered compared to single-purpose extensions
8. Pesticide
⭐⭐⭐⭐ 8.2/10 — Outlines every element on the page instantly
🔗 Get it on the Chrome Web Store
📸 [Screenshot placeholder — add a screenshot of a page with element outlines toggled on here]
Adds colored outlines to every element on a page with one click, making overflow, margin, and alignment bugs visually obvious.
Why it matters: spotting why a flex or grid layout is misbehaving is much faster when you can see every box border at once instead of inspecting elements one at a time.
Best for: fast visual debugging of layout and spacing issues.
Pros:
- Minimal, single-purpose, no configuration needed
- Genuinely faster than manually inspecting each element for a spacing bug
Cons:
- The original "Pesticide" listing was removed in the 2024 Manifest V2 cleanup — make sure you're installing an actively maintained Manifest V3 fork like the one linked above
- Outlines everything at once, which can be visually noisy on dense pages
Performance & SEO
9. Lighthouse
⭐⭐⭐⭐⭐ 9.3/10 — A full performance, SEO, and accessibility audit in one click
🔗 Get it on the Chrome Web Store
📸 [Screenshot placeholder — add a screenshot of a Lighthouse score report here]
Runs an automated audit and scores a page on performance, accessibility, best practices, and SEO, with specific recommendations for each issue found. Built and maintained directly by Google.
Why it matters: this is the tool that catches Core Web Vitals and CLS issues — the same category of problem behind the HeroImage CLS fixes on this blog — before a client or search engine does.
Best for: running a full audit before a deploy or client handoff.
Pros:
- Official Google tool, same engine as the Lighthouse panel built into DevTools
- Scored report format is easy to hand to a non-technical client
Cons:
- Desktop results can look better than what real mobile users experience — pair with Web Vitals or real device testing
- A full audit takes noticeably longer than a quick live-badge check
10. Web Vitals
⭐⭐⭐⭐ 8.5/10 — Live Core Web Vitals badge while you browse normally
🔗 Get it on the Chrome Web Store
📸 [Screenshot placeholder — add a screenshot of the toolbar badge showing LCP/CLS values here]
Shows LCP, INP, and CLS as a small live badge in the toolbar instead of requiring a full Lighthouse run. Built by the Chrome team.
Why it matters: it catches a performance regression in the moment, while browsing normally, rather than only when you remember to run a formal audit.
Best for: ongoing awareness of performance metrics during regular development, not just at deploy time.
Pros:
- Zero-friction, always-on feedback instead of a manual audit step
- Matches how Chrome itself measures and reports these metrics to Search Console
Cons:
- Reflects your desktop machine's performance, not the median mobile device your users likely have
- Doesn't give the "why," just the number — you'll still want Lighthouse for the diagnostic breakdown
GitHub & Git Workflow
11. Refined GitHub
⭐⭐⭐⭐⭐ 9.0/10 — Fixes the GitHub UI's missing features
🔗 Get it on the Chrome Web Store
📸 [Screenshot placeholder — add a screenshot of a PR diff with Refined GitHub's enhancements visible here]
Adds dozens of small but meaningful improvements to GitHub's interface — better diffs, quicker PR navigation, and missing quality-of-life features GitHub itself hasn't shipped.
Why it matters: if you spend real time reviewing pull requests or diffs, the cumulative time saved from these small improvements adds up fast.
Best for: anyone who lives in GitHub's PR and code review flow daily.
Pros:
- Actively maintained, open source, GitHub has adopted several of its ideas natively over time
- Individual features can be toggled off if you only want a subset
Cons:
- Highly opinionated defaults — expect to spend a few minutes in settings turning off anything you don't want
- Occasionally lags a day or two behind a GitHub UI redesign before an update ships
12. Octotree
⭐⭐⭐⭐ 8.7/10 — A file-tree sidebar for browsing GitHub repos
🔗 Get it on the Chrome Web Store
📸 [Screenshot placeholder — add a screenshot of the collapsible file-tree sidebar here]
Adds a collapsible file-tree sidebar to any GitHub repository page, so you can navigate files the way you would in a code editor instead of clicking through folder links one at a time.
Why it matters: for exploring an unfamiliar repo or jumping between files in a large project, this is noticeably faster than GitHub's default file browser.
Best for: reviewing or exploring codebases directly on GitHub without cloning them locally first.
Pros:
- Free tier covers the core file-tree use case completely
- Works on private repos with minimal setup
Cons:
- Some features (file icon themes, unlimited bookmarks, multi-account support) are Pro-only
- Large monorepos can take a moment to fully index on first load
General Dev Utility
13. Wappalyzer
⭐⭐⭐⭐ 8.3/10 — See what a website is built with
🔗 Get it on the Chrome Web Store
📸 [Screenshot placeholder — add a screenshot of the detected tech-stack popup here]
One click reveals a site's tech stack — CMS, analytics tools, JavaScript frameworks, hosting provider, and more — directly from the toolbar icon.
Why it matters: genuinely useful for quick competitive or reference research on how another site is built.
Best for: developers curious what's running under the hood of a site they're referencing.
Pros:
- Detects over a thousand technologies across dozens of categories
- CSV export makes it easy to compile a list across multiple competitor sites
Cons:
- Detection is best-effort and can misidentify heavily customized or obfuscated stacks
- Broad site-access permission is required for it to function, same caveat as the API testing tools above
14. Cache Killer
⭐⭐⭐⭐ 8.1/10 — Force-disables cache while testing
🔗 Get it on the Chrome Web Store
📸 [Screenshot placeholder — add a screenshot of the on/off toggle icon here]
Automatically clears browser cache before loading a page, so changes to a page show up immediately without manually clearing cache each time.
Why it matters: it removes the "why isn't my change showing up" loop that wastes more time than it should, especially after a deploy.
Best for: active development and testing where cached assets would otherwise mask a fresh change.
Pros:
- One-click on/off, no configuration required for basic use
- Lightweight, doesn't noticeably slow down page loads
Cons:
- Resets to "off" on browser restart unless you enable "Enable on start" in settings
- Several similarly named "cache killer" extensions exist with mixed reputations — confirm you're on the listing linked above before installing
15. ColorZilla
⭐⭐⭐⭐ 8.6/10 — An eyedropper and color picker for any webpage
🔗 Get it on the Chrome Web Store
📸 [Screenshot placeholder — add a screenshot of the eyedropper picking a color from a live page here]
Pick any color from any webpage and generate CSS gradients directly from what you see on screen.
Why it matters: matching a brand color from a live reference site is instant instead of guessing at a hex value.
Best for: quick color matching during frontend work without opening a full design tool.
Pros:
- One of the longest-standing, most trusted extensions in this category
- Gradient generator is a nice bonus most competitors skip
Cons:
- Interface feels a little dated compared to newer design-focused tools like CSS Peeper
- Picker can occasionally struggle with colors rendered inside
<canvas>elements
What I Left Off This List
- General-purpose AI chat sidebar extensions. Several are genuinely useful, but I've kept this list narrowly focused on tools with a single clear developer function rather than broad AI assistants, which deserve their own separate roundup.
- Extensions duplicating built-in DevTools features with no real added value. If Chrome's own DevTools already does something well, adding a redundant extension just adds another update to track.
- Anything abandoned, unmaintained, or flagged for security issues. As the ModHeader situation above shows, an install count and years of history aren't a guarantee — an unmaintained or compromised extension is a bigger risk on a dev machine than almost anywhere else, given the access it often needs to page content and network requests.
More Useful Resources
- Top 20 Chrome Extensions Worth Installing in 2026 — the general-purpose companion to this list
- More Tech & Tools Articles
- 9 AI Tools That Are Actually 100% Free for Developers in 2026
- 10 AI Prompts Every Job Seeker Needs in 2026
This list reflects extensions actively in use on real Django and React projects, re-verified on Chrome 151 (current stable, early August 2026). If something here stops being maintained, gets flagged for security issues, or a better alternative comes along, I'll update this post rather than let it go stale — as the ModHeader correction above shows.
Did you find this helpful?
FAQ